Reports View

This article will guide you through the different sections of the evaluation report view, helping you understand how to interpret the scoring chart, conclusions block, product score calculation, etc.

Scoring Chart
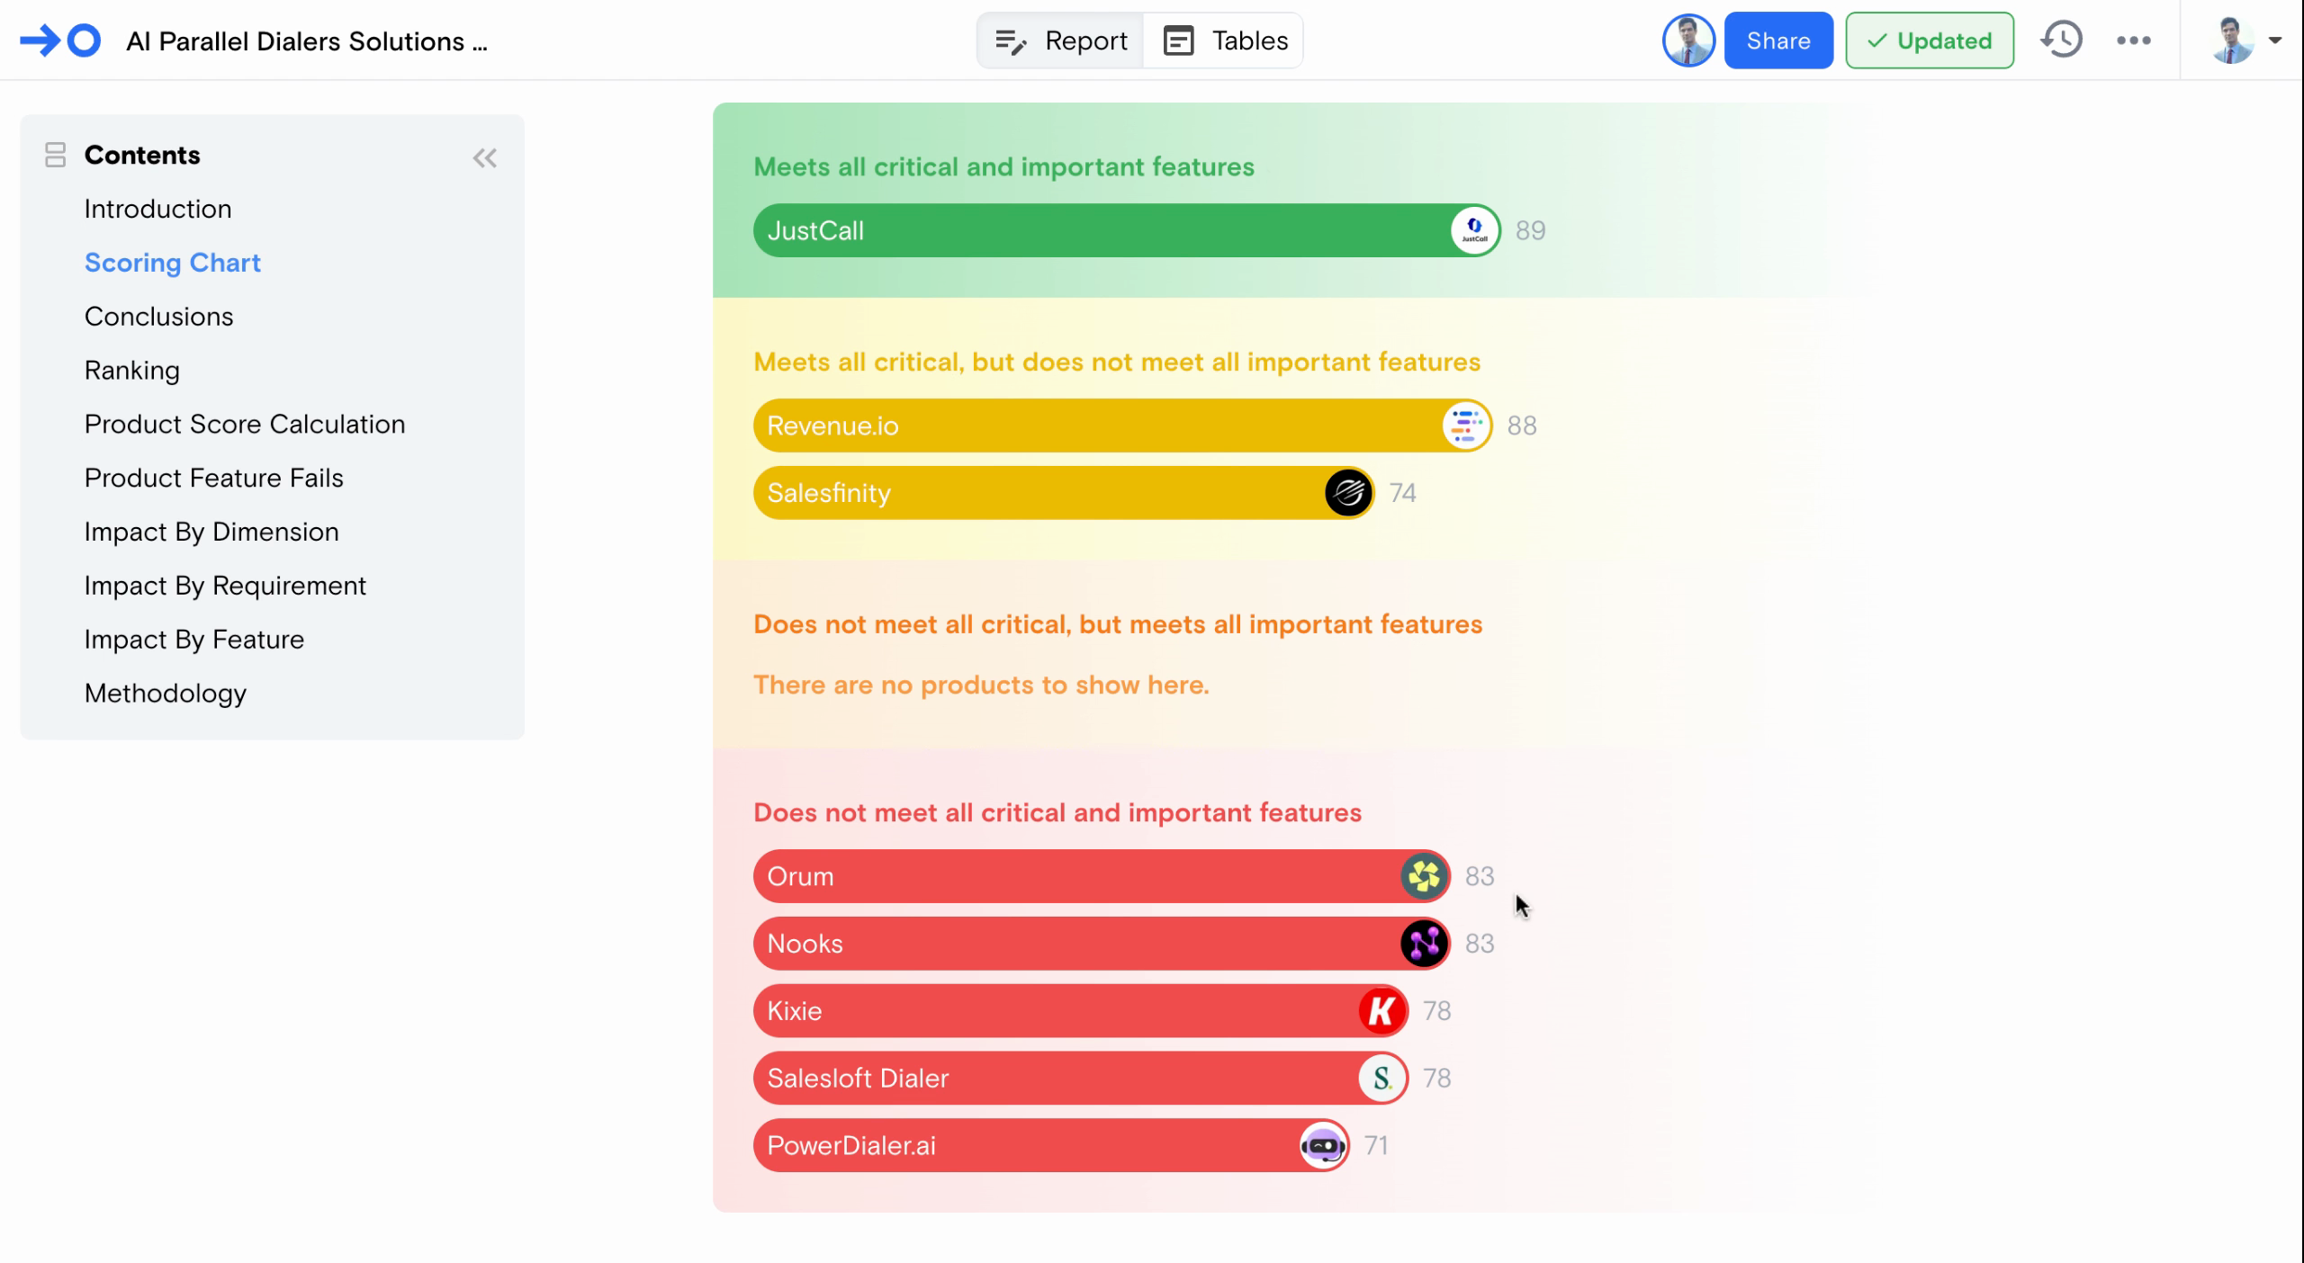
The scoring chart categorizes products based on their ability to meet critical and important feature criteria. It also ranks vendors within these categories by score. Note that a vendor with a higher score may rank lower if it doesn't meet all critical features.

Conclusions Block

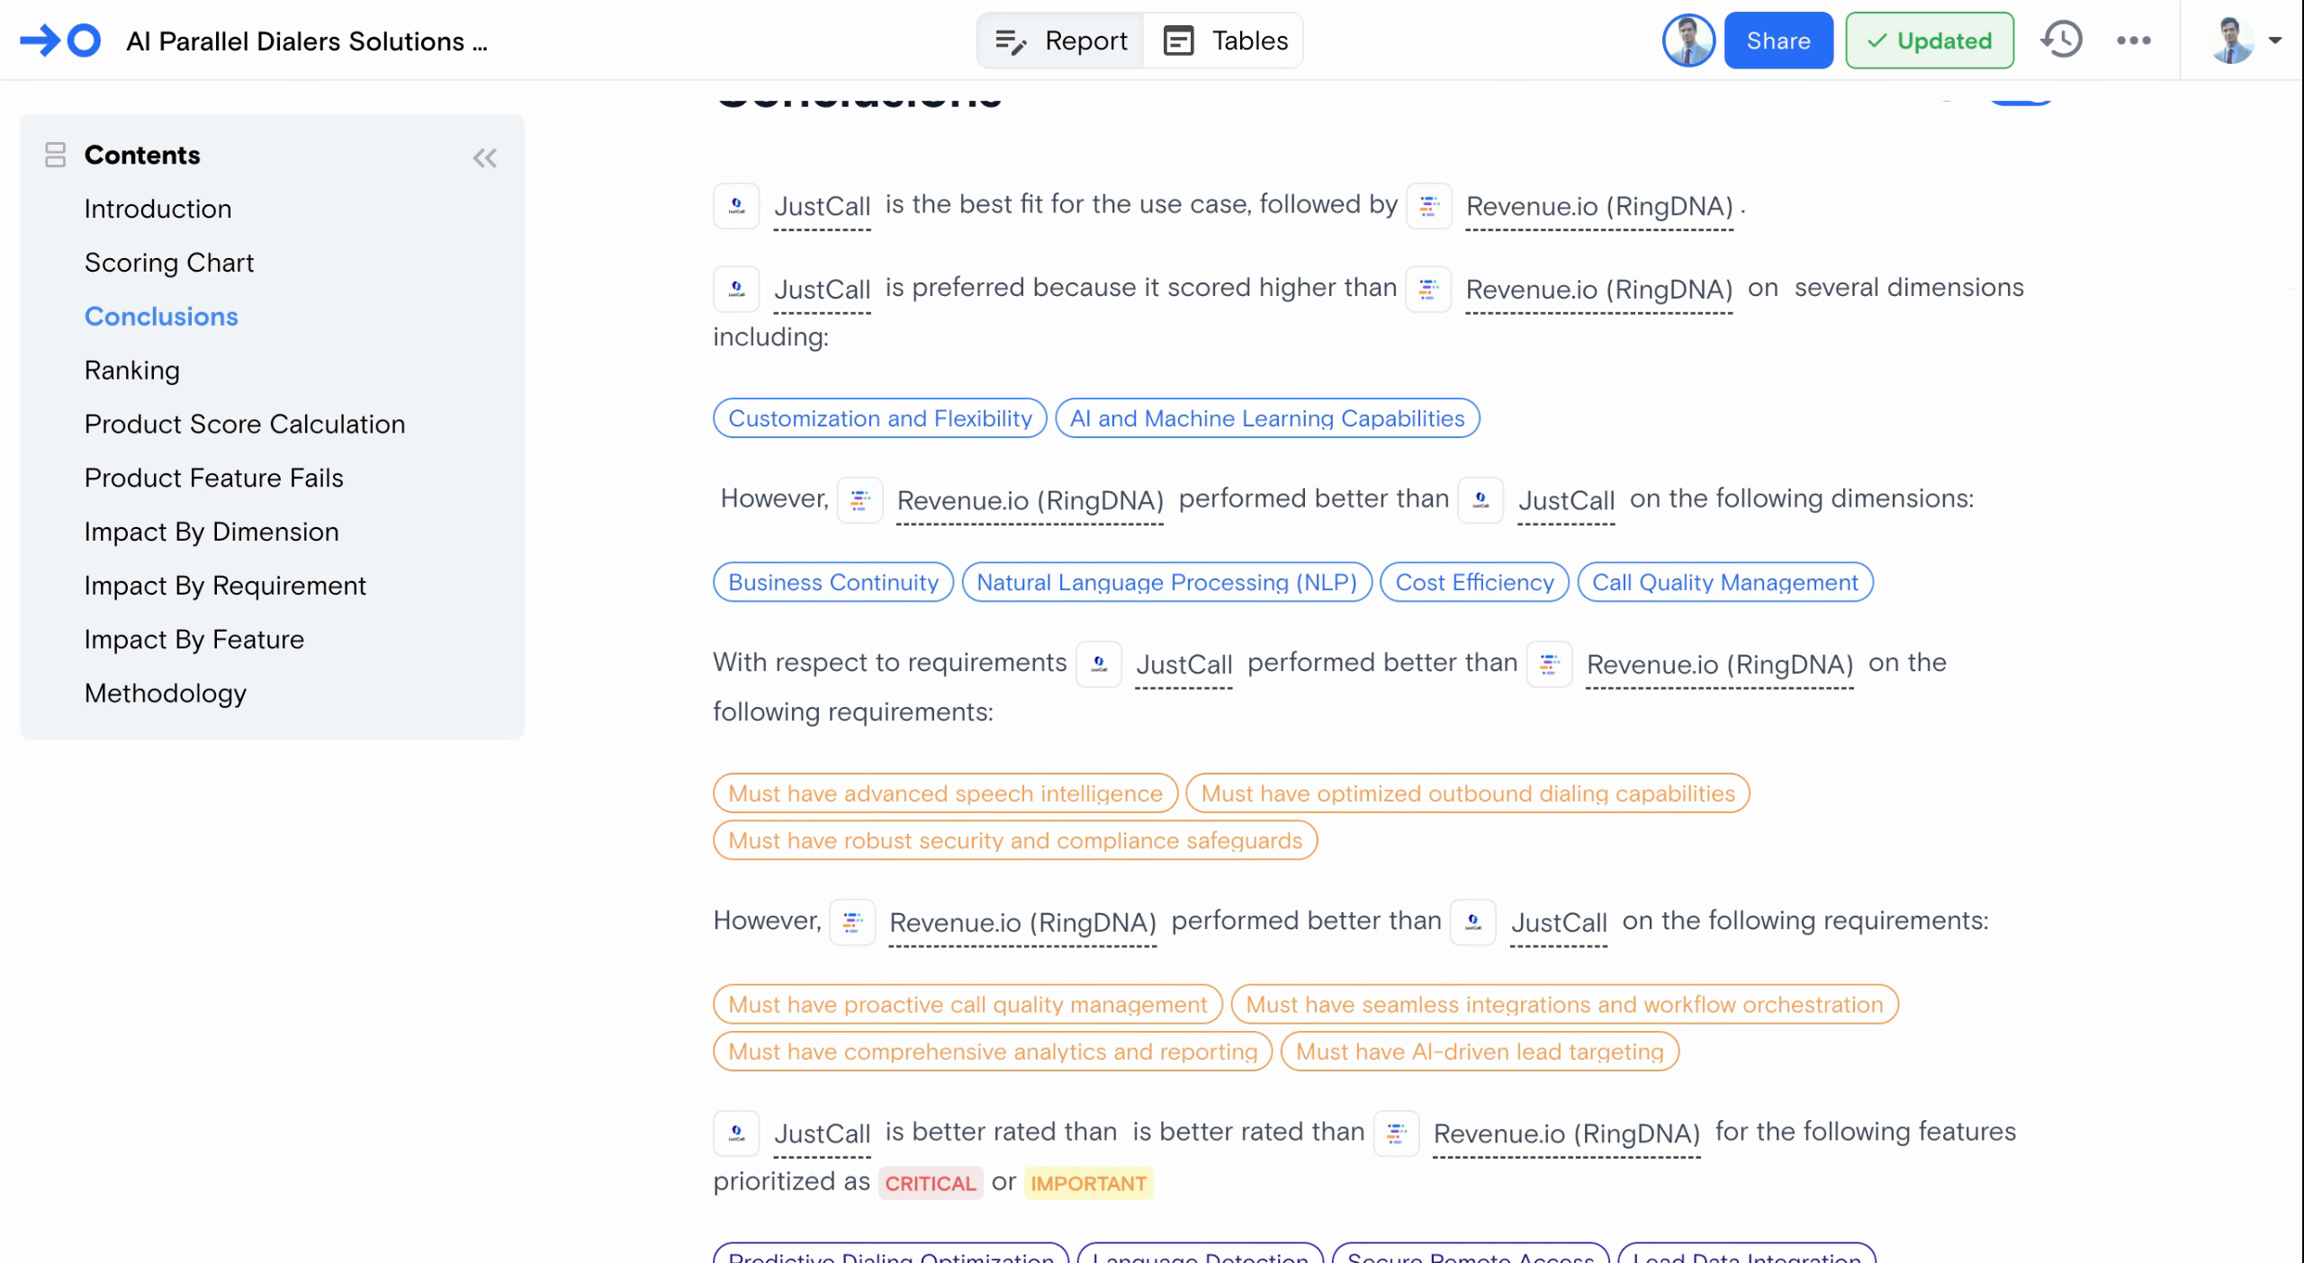
This section identifies the winner and runner-up, explaining why the winner outperformed the runner-up. It breaks down the key dimensions and trade-offs at the requirements and features level, helping you understand the basis of the recommendation.

Continue down, and you can explore the detailed product rankings. You'll find an explanation for each product's ranking.

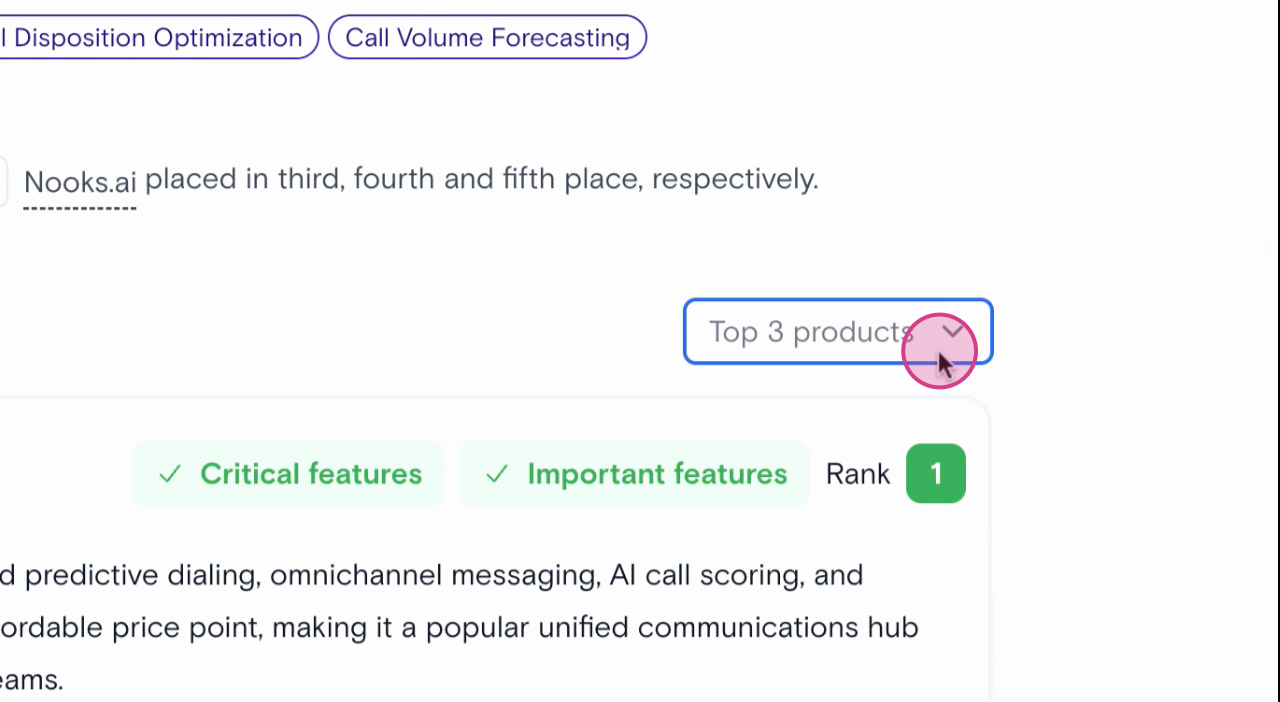
Toggle to see more products if needed.

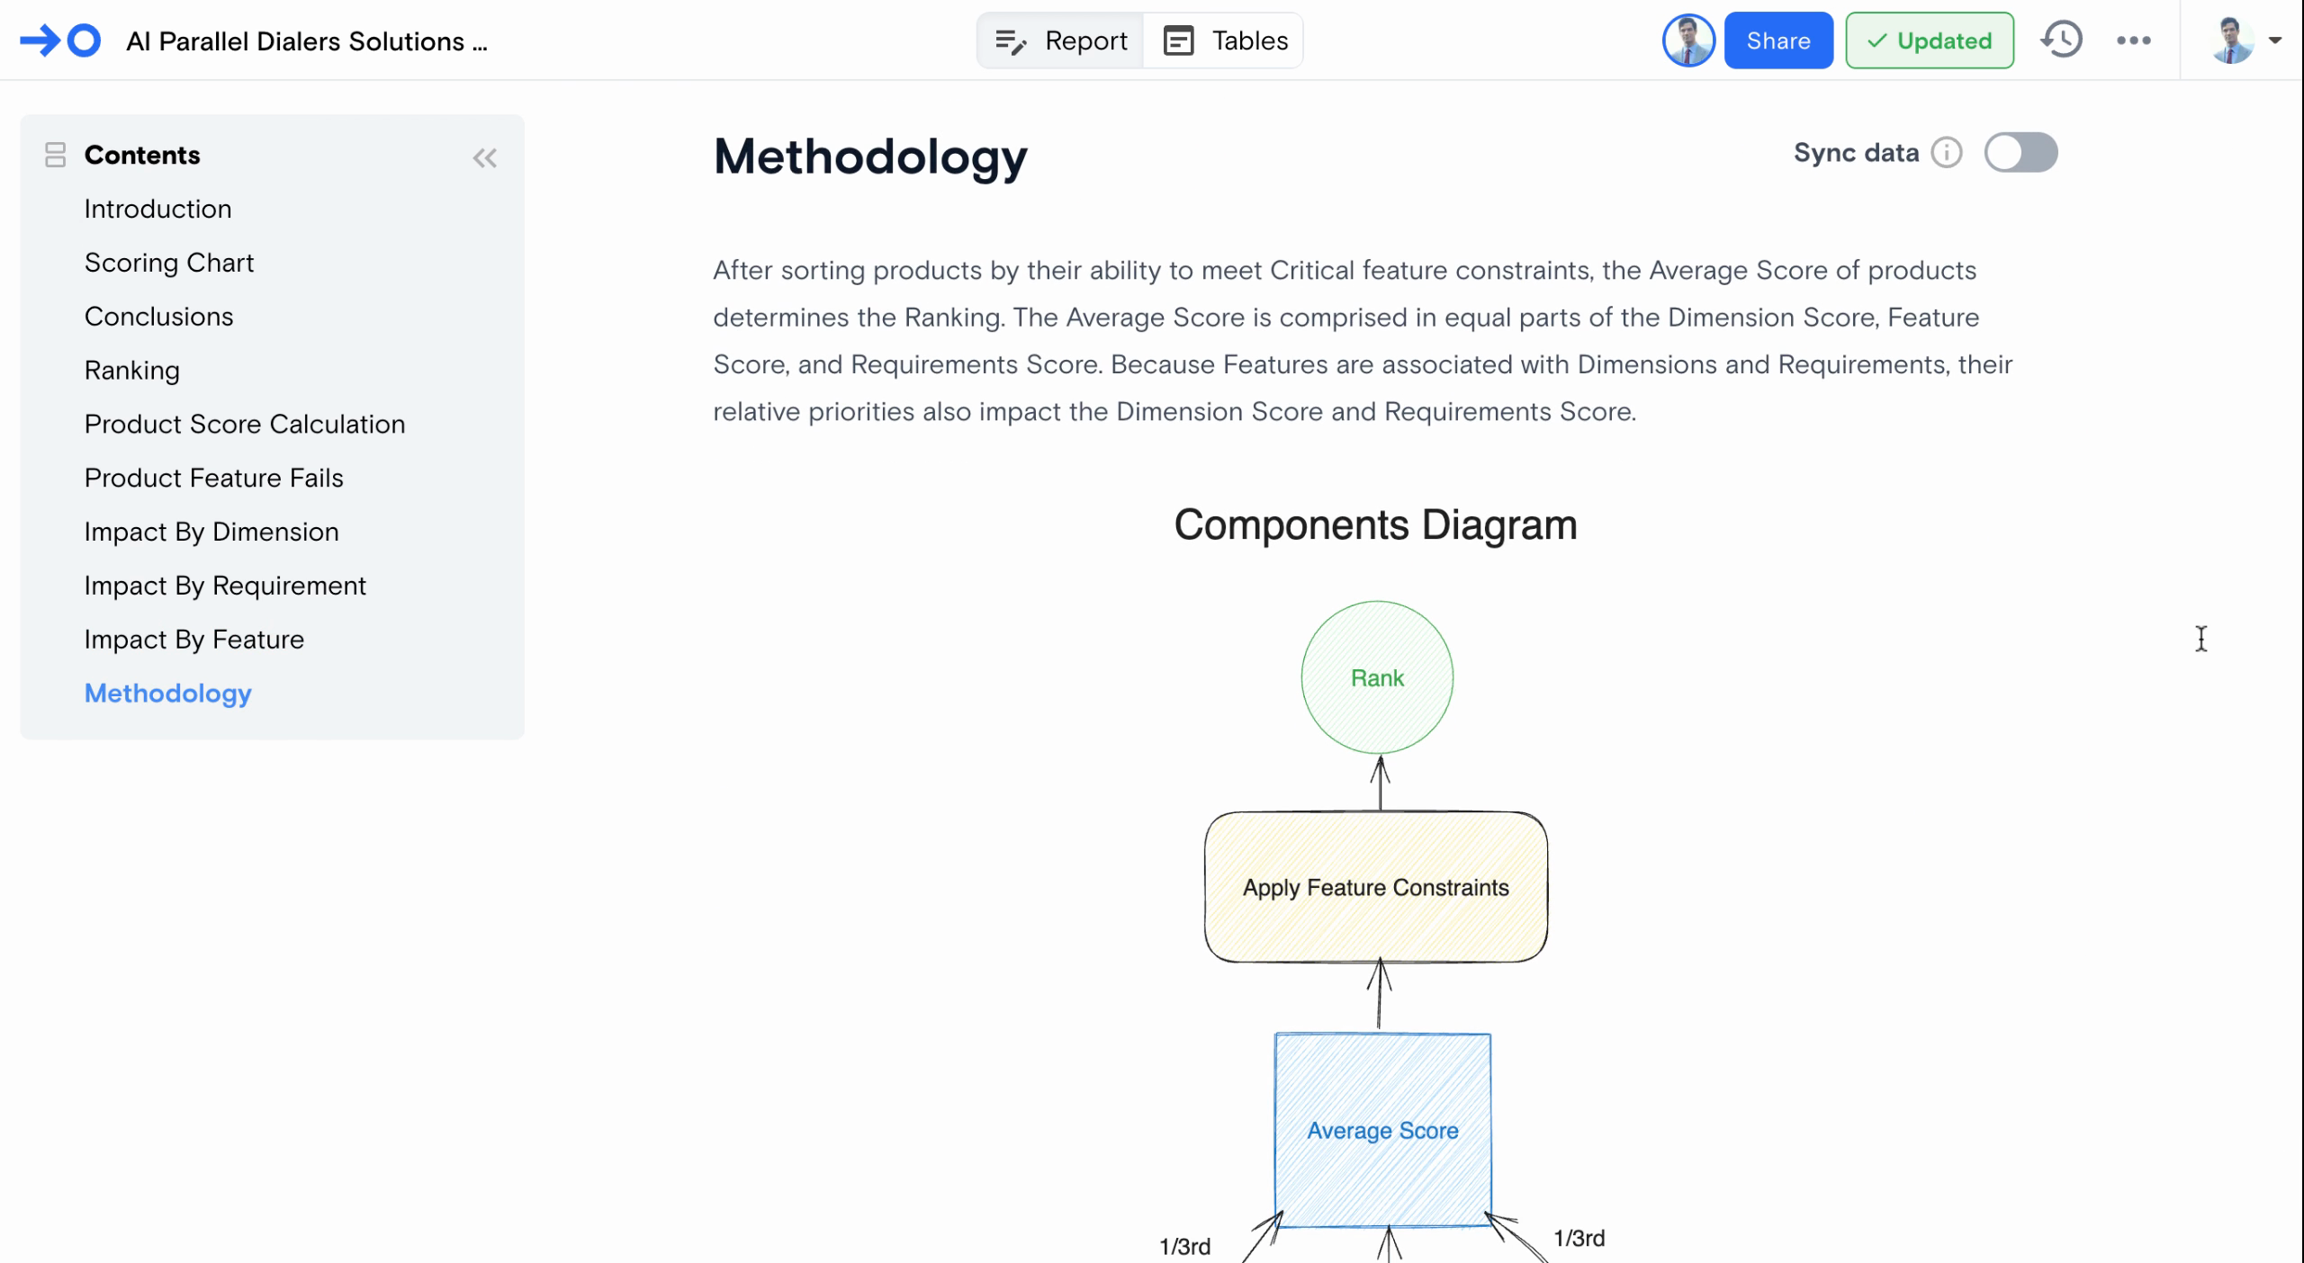
This sections below explain how the Future Score, Dimension score, and Requirement score work together to produce an average score, which is then used to rank vendors.

This Product Features Fails table shows how many critical, important, or nice-to-have features each product failed. It helps you see the key differences between vendors.

Impact Visualizations and Tables

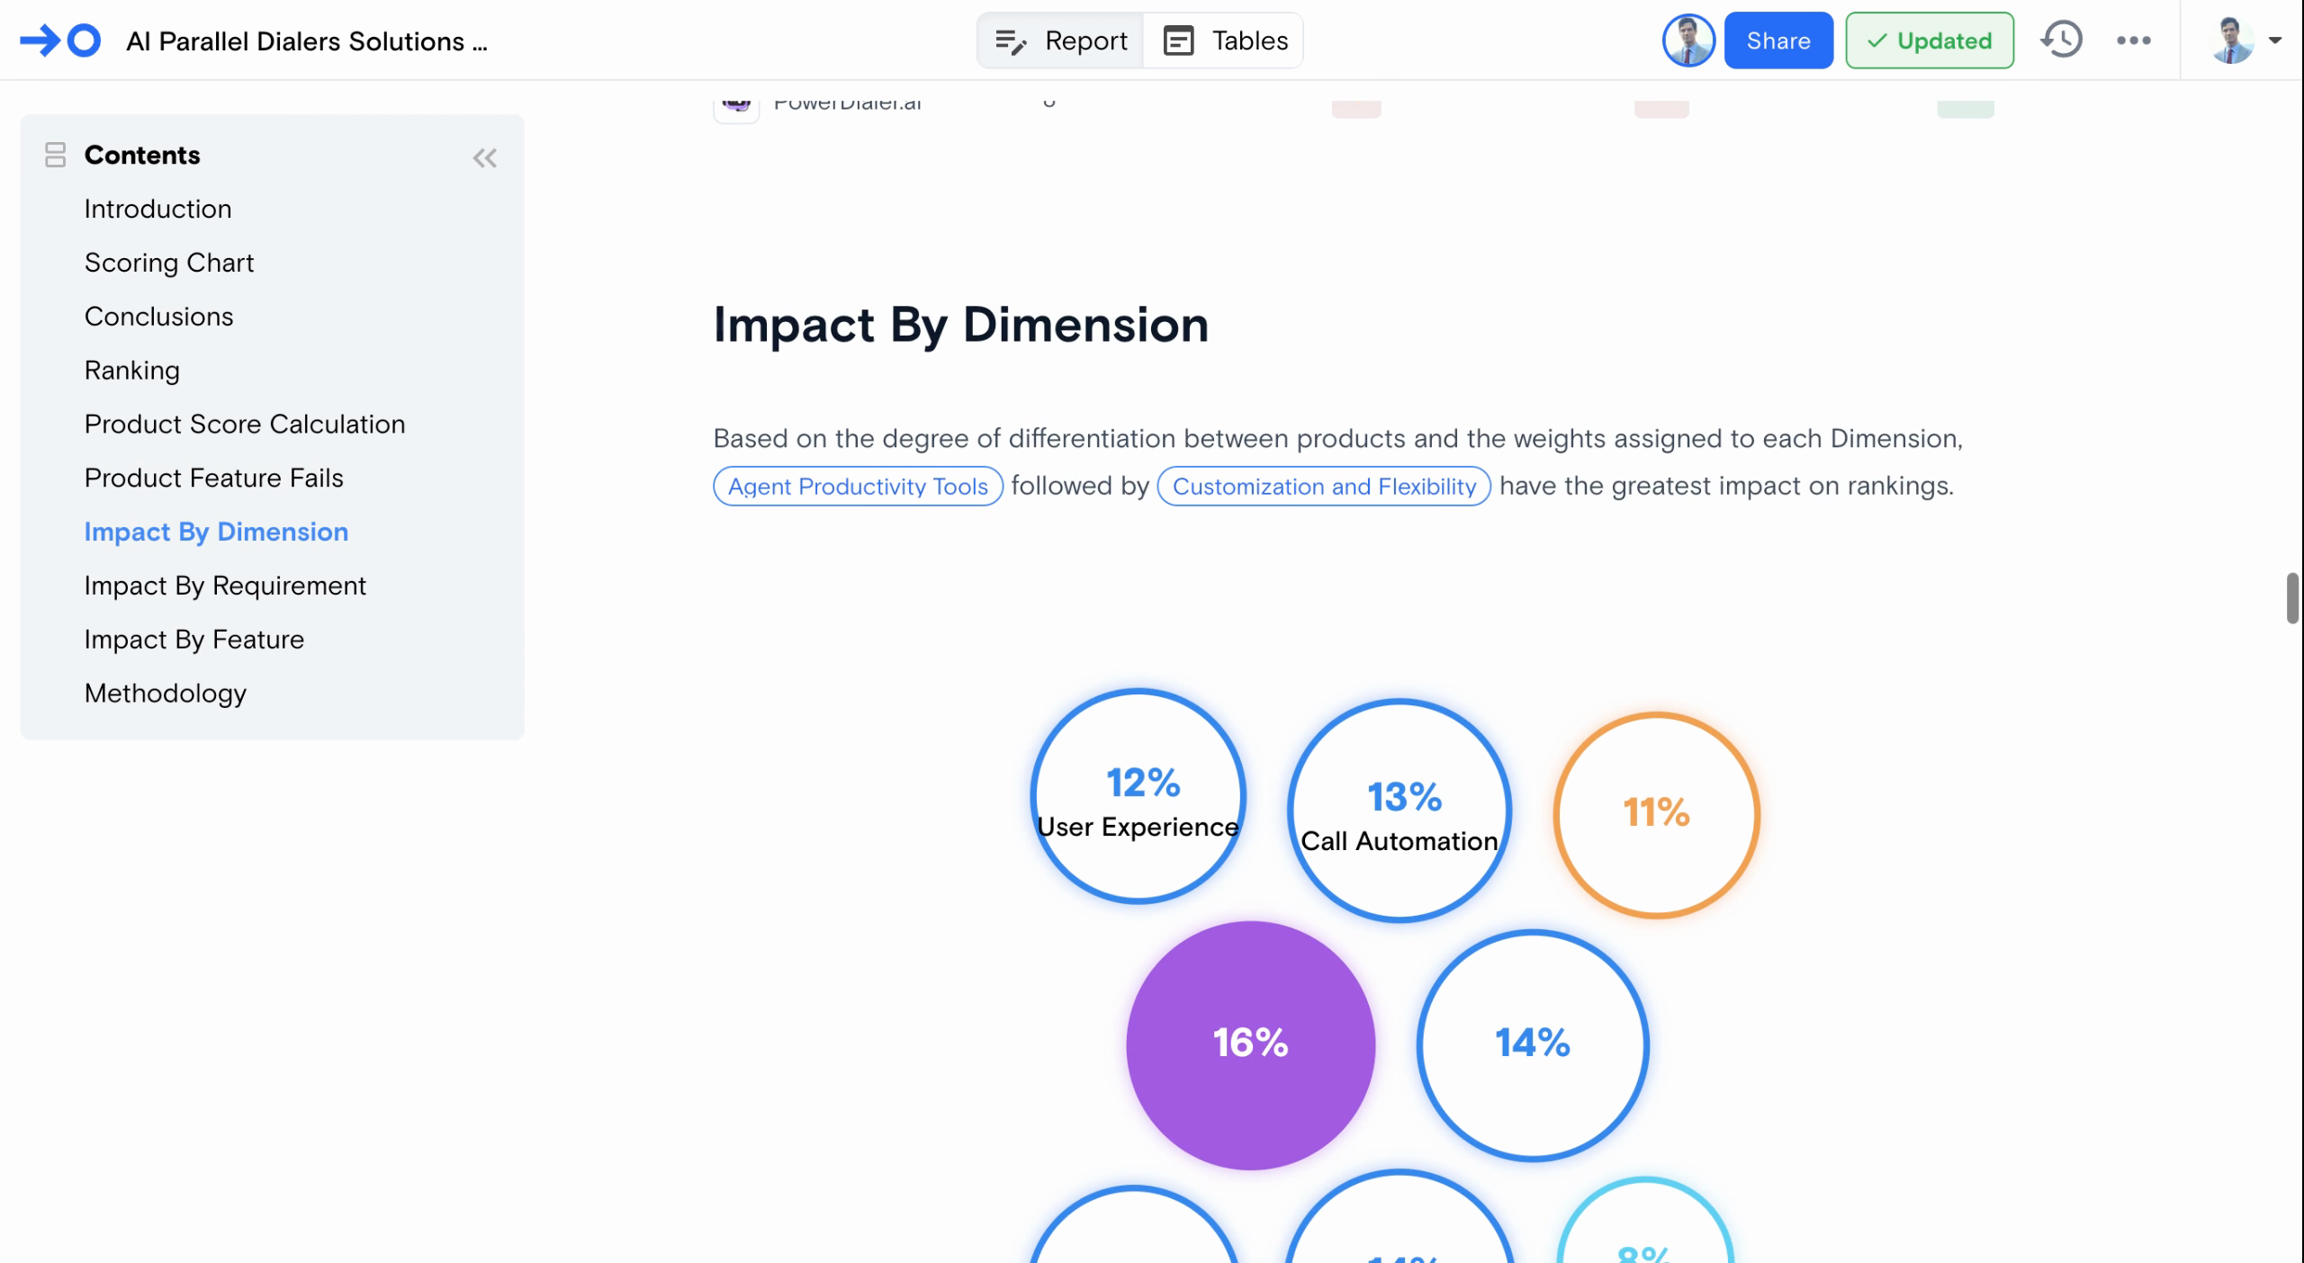
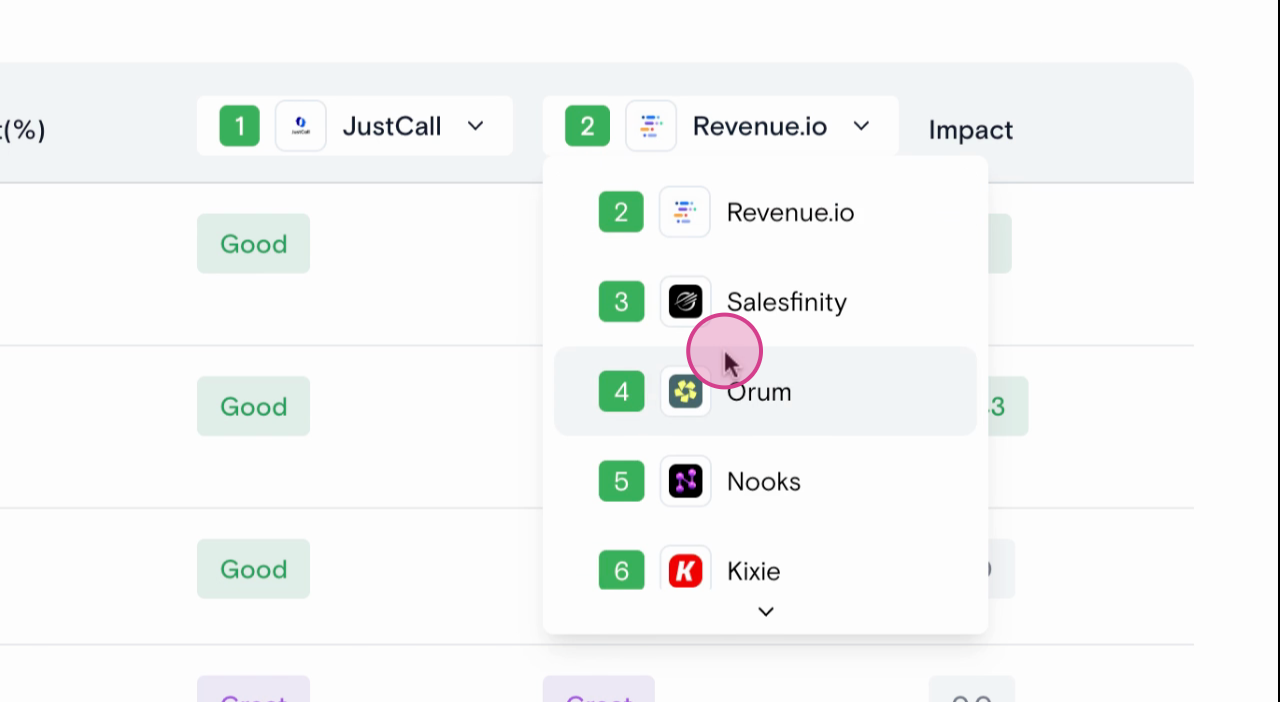
These sections break down which dimensions had the most significant impact on the overall scores and rankings. You can toggle and compare different vendors to understand the trade-offs.

Drill into similar charts at the requirements level and the features level. For instance, you might find that a specific feature, like language detection, made a significant difference between two vendors.

Methodology Section

The methodology section explains how the different components contribute to the final score and rank. It also lists the products included in the evaluation.

Renaming the Evaluation

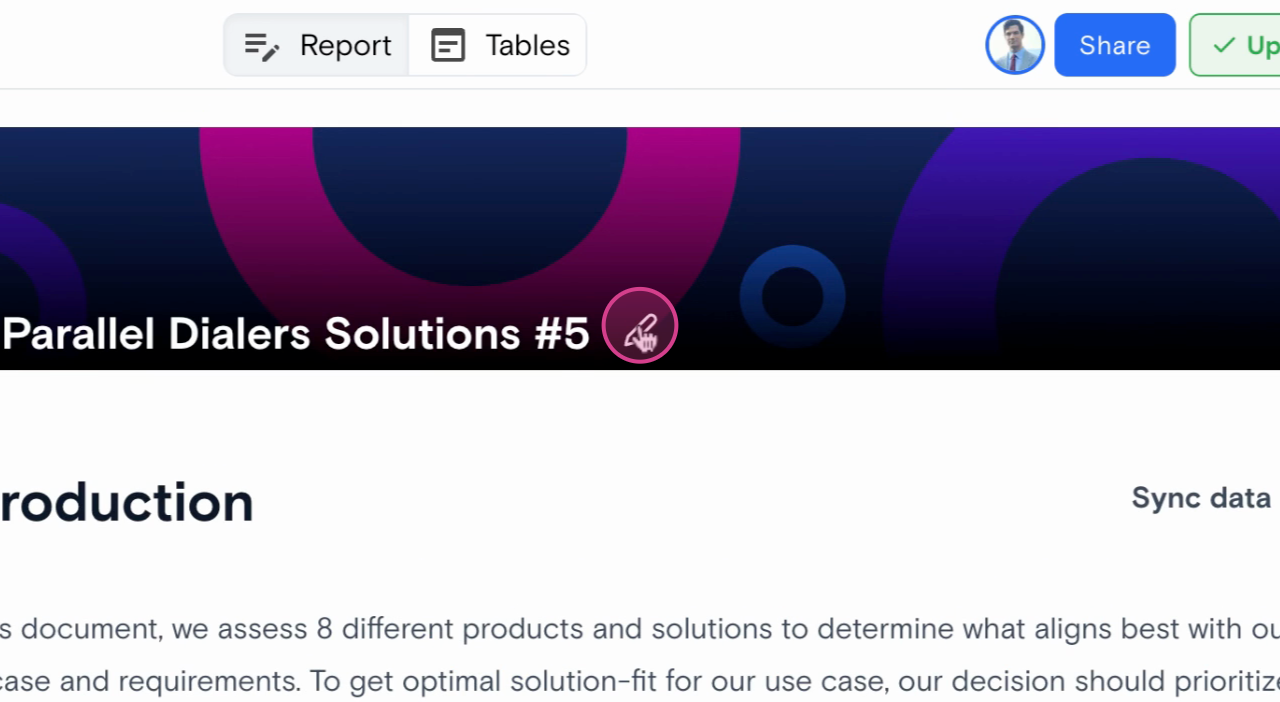
Finally, know that you have the option to rename your evaluation within the report view.

Last updated

Was this helpful?